No change to US ending stocks, corn continues sideways to lower trade
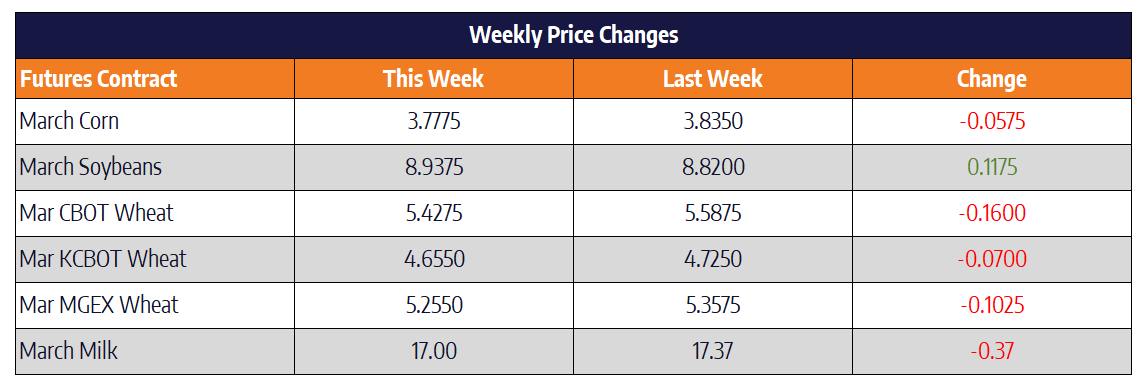
March corn was 5-3/4 cents lower on the week to settle at 377-3/4. December corn closed the week at 388-3/4, down 5-1/4. The USDA made little to no changes to its corn balance sheet on its February Supply and Demand update released at 11 am CST Tuesday. US ending stocks were pegged at 1.892 billion bushels; this was unchanged from the January estimate. World corn ending stocks were estimated at 296.84 million tons, down from 297.81 million tons in January. Brazil’s second crop corn planting was nearing 20% completed as of Wednesday. This is about 10% slower than the 5-year average but is seen as a non-concern currently. Domestic corn prices in Brazil have recently hit a four-year high on strong feed demand and use for ethanol, and that is despite the record harvest of 2018-2019.
Reports surfaced on Friday that buyers in China bought corn from Ukraine this week. Although the sale is not uncommon, it caught the attention of global grain traders. Such sales continue to raise doubts about China’s commitment to buy US ag products, given the Phase One trade agreement. With the current corn to soybean price ratio, the case for more corn acres in 2020 continues to grow. MAP and DAP prices, which are 19% lower than a year ago as well as UAN prices, which are 12% lower than a year ago, strengthen the 94+ million-acre corn argument as well. As with any year, mother nature will have the last say on what can get planted when.
Soybeans find support on an increase in export projections
March soybeans were 11-3/4 cents higher this week to close at 893-3/4. November soybeans closed at 922-1/2, up 4 cents this week. Tuesday’s USDA Supply and Demand update was seen as supportive to the soybean market. US ending stocks were estimated at 425 million bushels versus trade estimate of 443 million bushels. Ending stocks were estimated at 475 million bushels back in January. The 50 million bushels cut to stocks was attributed to the USDA increasing exports by that exact amount. Soybean export sales are 9% ahead of the pace seen last year. The USDA has stated that they will need to see Chinese follow though from the Phase One agreement before increasing export projections drastically. Since the beginning of the year, China has slowed US soybean purchases with less than 1 million metric ton purchased in the last 45 days. The coronavirus outbreak continues to create logistical headaches within China, making ag purchases from the US even more difficult.
Brazilian soybean harvest in Mato Grasso, Brazil’s top soybean producing state, was 45% complete as of Friday. This is above the average of 32% but behind last year’s record pace. Brazilian growers have the weak real currency on their side, and that is making sales of their crops very attractive as they are sold in US dollars. The real hit an all-time low against the dollar on Thursday, some 9% lower than at the start of the year. Brazil’s own statistics agency, Conab, increased their soybean crop estimate Tuesday to 123.25 million metric tons from last month’s estimate of 122.2 million metric tons. This compares with Tuesday’s USDA estimate of 125 MMT.
Chicago wheat charts turn negative
March Chicago wheat was 16 cents lower this week to close at 542-3/4. March Kansas City wheat was 7 cents lower this week to close at 465-1/2. March Minneapolis Spring wheat was 10-1/4 cents lower to close at 525-1/2 this week. Following Tuesday’s USDA report, Chicago wheat traded lower. Wheat prices broke support from a line dating back to September. The head and shoulders formation on Chicago wheat points to prices trading close to 50 cents lower, this would bring prices back near their November lows near the $5 mark if the formation rings true. US dollar index trading into new 4-month highs will also put pressure on wheat exports moving forward.
Dairy Markets Drag Lower on Friday
The dairy market was red across the board for the second day in a row. Block cheddar prices dropped 4.5 cents on no loads traded while barrels remained unchanged on 15 loads traded. While it is nice to see the spread between the two products lower, the fact that blocks are dropping and barrels aren’t rising pressures markets. Non-fat powder was the biggest lower in the dairy spot trade this week finishing 8 cents lower from the start of the week. Recent fear of the Chinese markets appears to be pressuring powder prices. This may start happening in whey as well with prices dropping 2.25 cents today. Butter prices remained unchanged today but had the most volume with 24 loads traded.
Class III and Class IV nearby contracts were down in similar increments this week. Class III contracts further into 2020 were only slightly lower on the day. Next week there will be another global dairy trade auction. The last one was down significantly and we will have to see if that market shakes off recent virus scares or continues to trend lower.


